Case study · Economic data · 2022-2023
Economic Dashboards Redesign: Ecometer & Agrimarket
Redesigned two economic dashboards for the Center for Economic Data & Analysis.
🦚 About the project
The Center for Economic Development (CEDA) at Ashoka University works on socio-economic data and facilitates informed discourse on key economic and social developments in India.
They wanted two of their economic dashboards redesigned for:
- Reducing complexity and making them more intuitive
- Making the visual language consistent across their various dashboards
- Making them visually attractive, clean, and modern
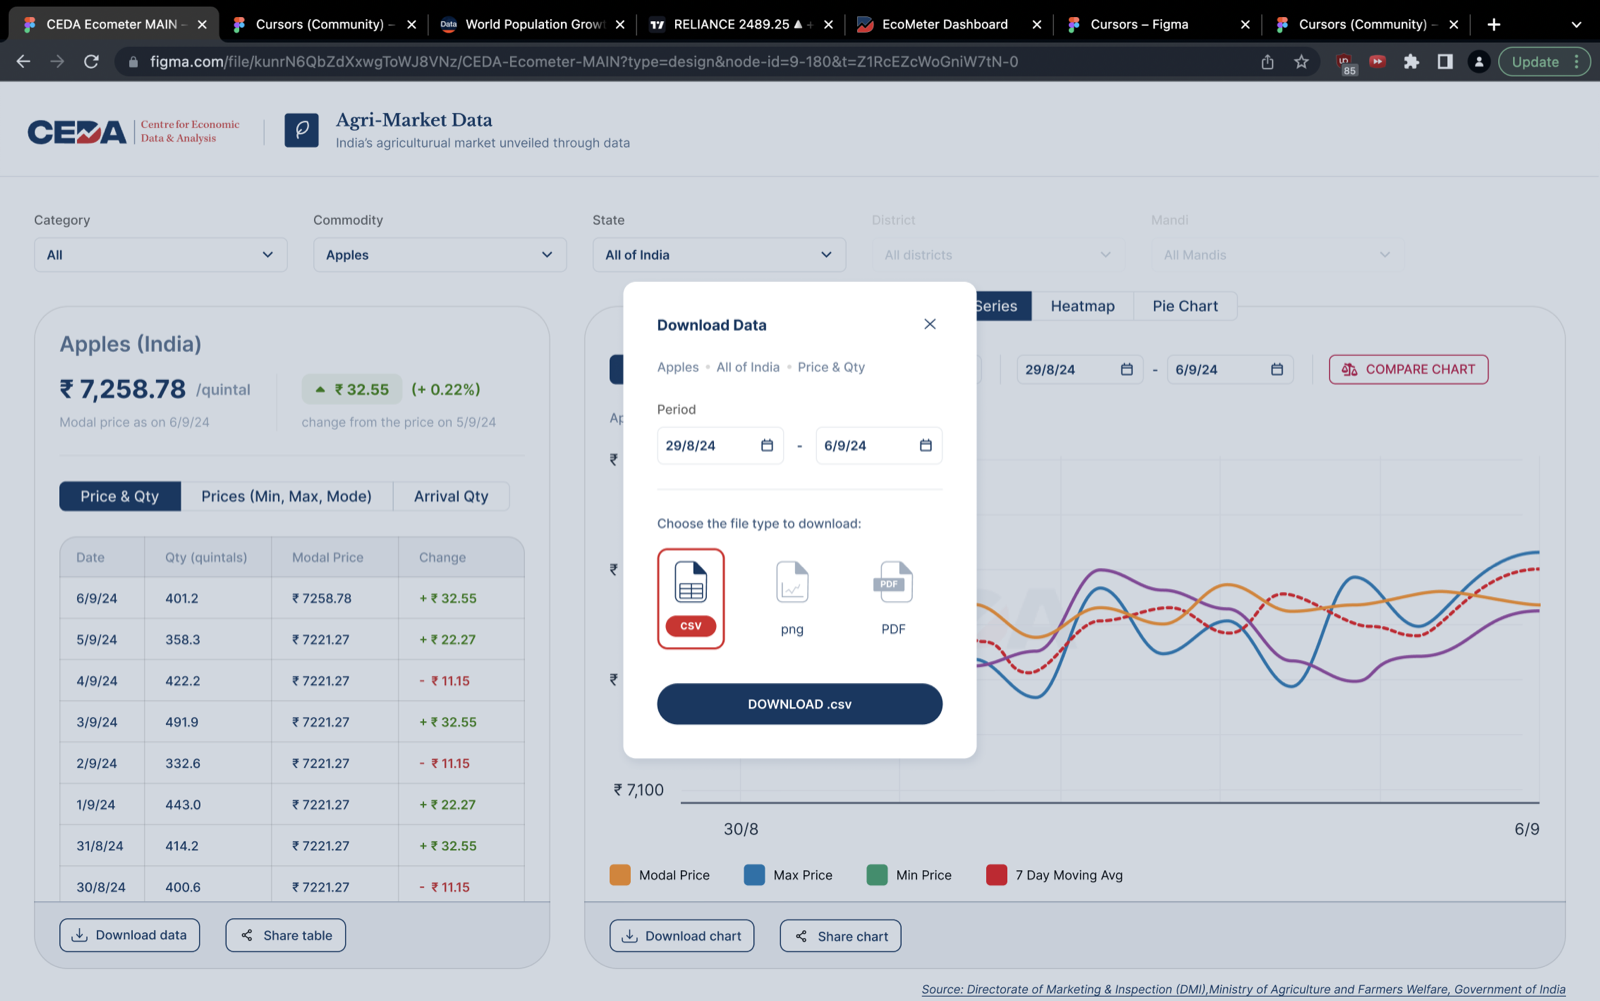
- Acquiring a new audience by facilitating the sharing of charts on social media
I was responsible for the complete end-to-end designs. Click any image to see it full size.
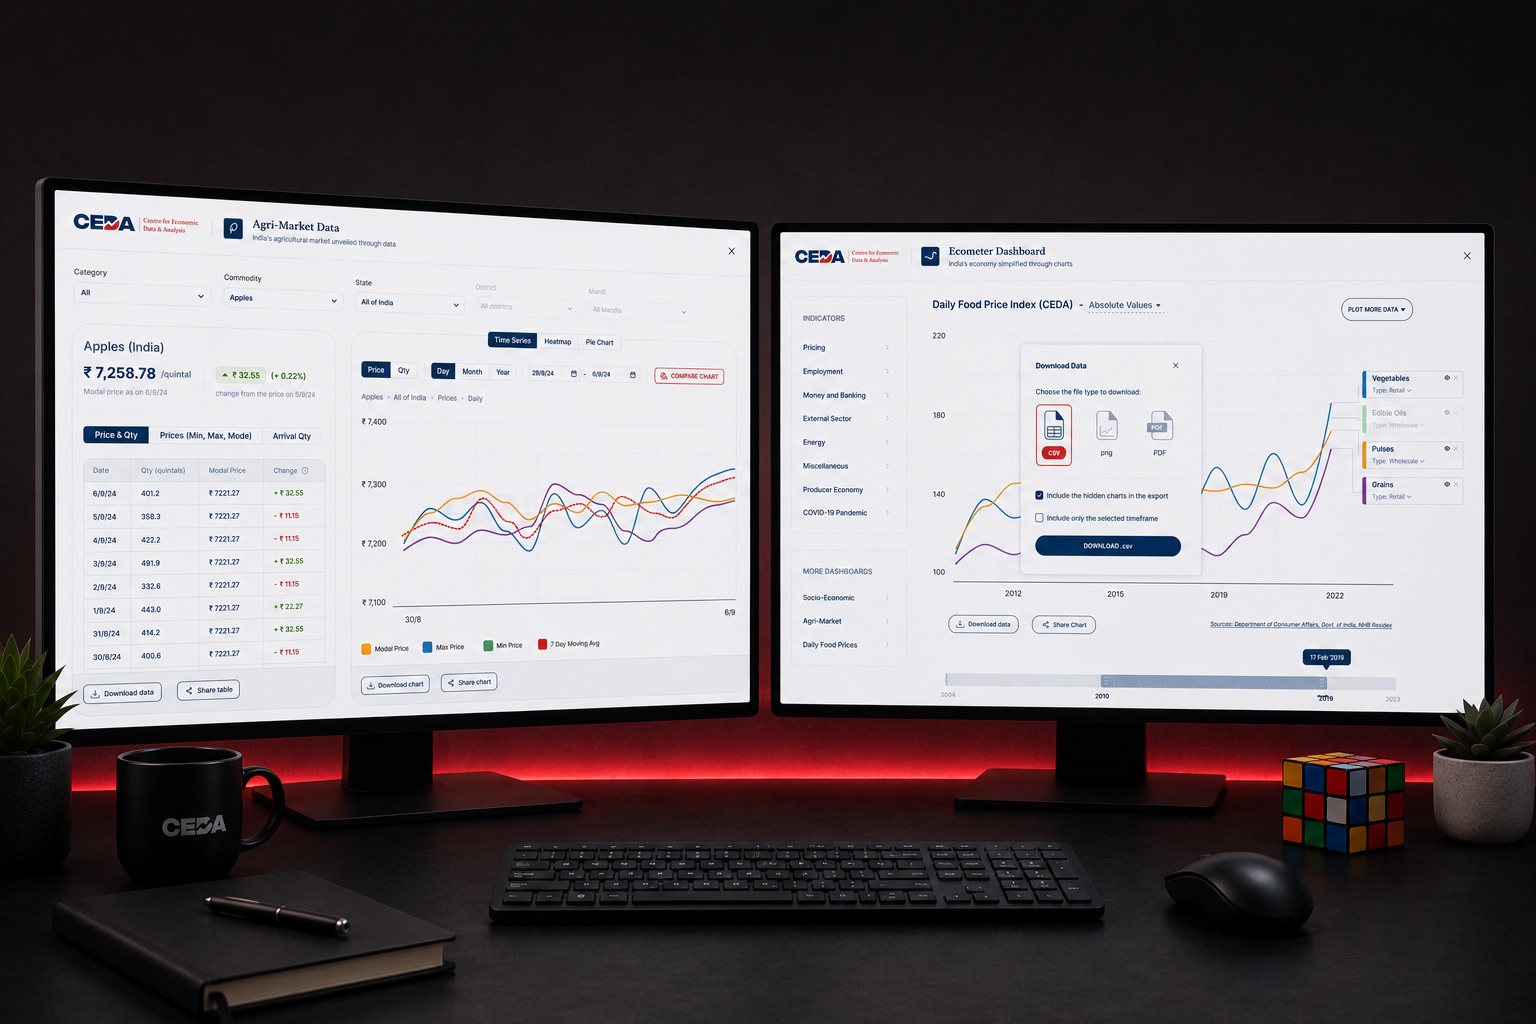
🏝️ The Dashboards
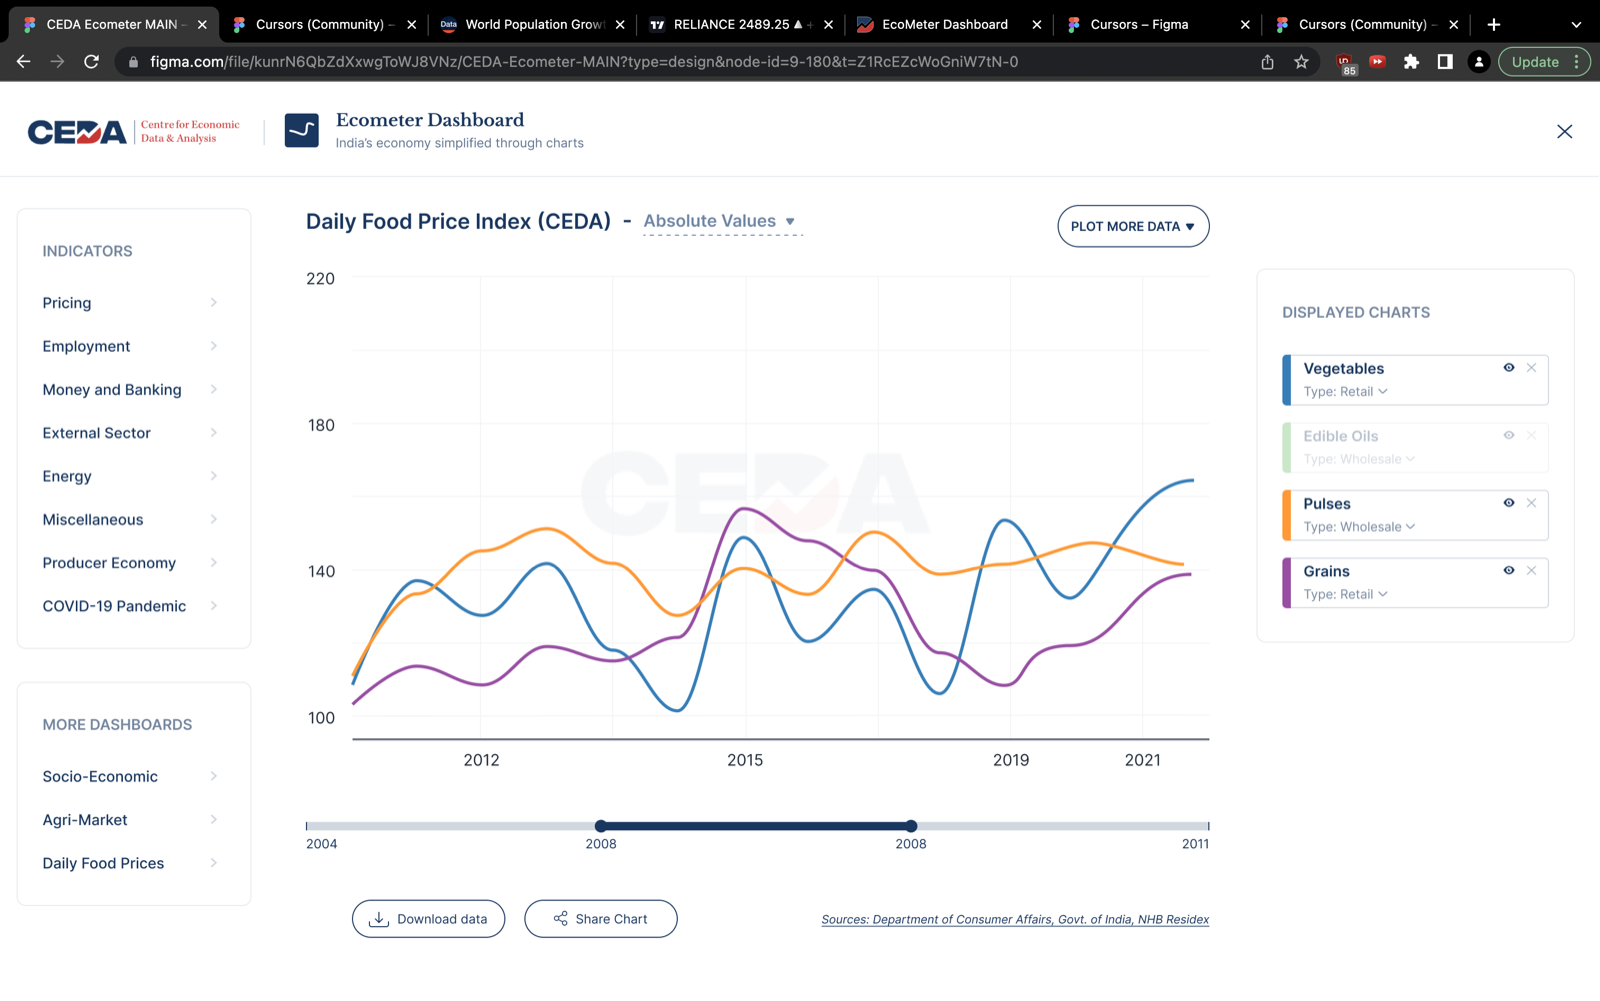
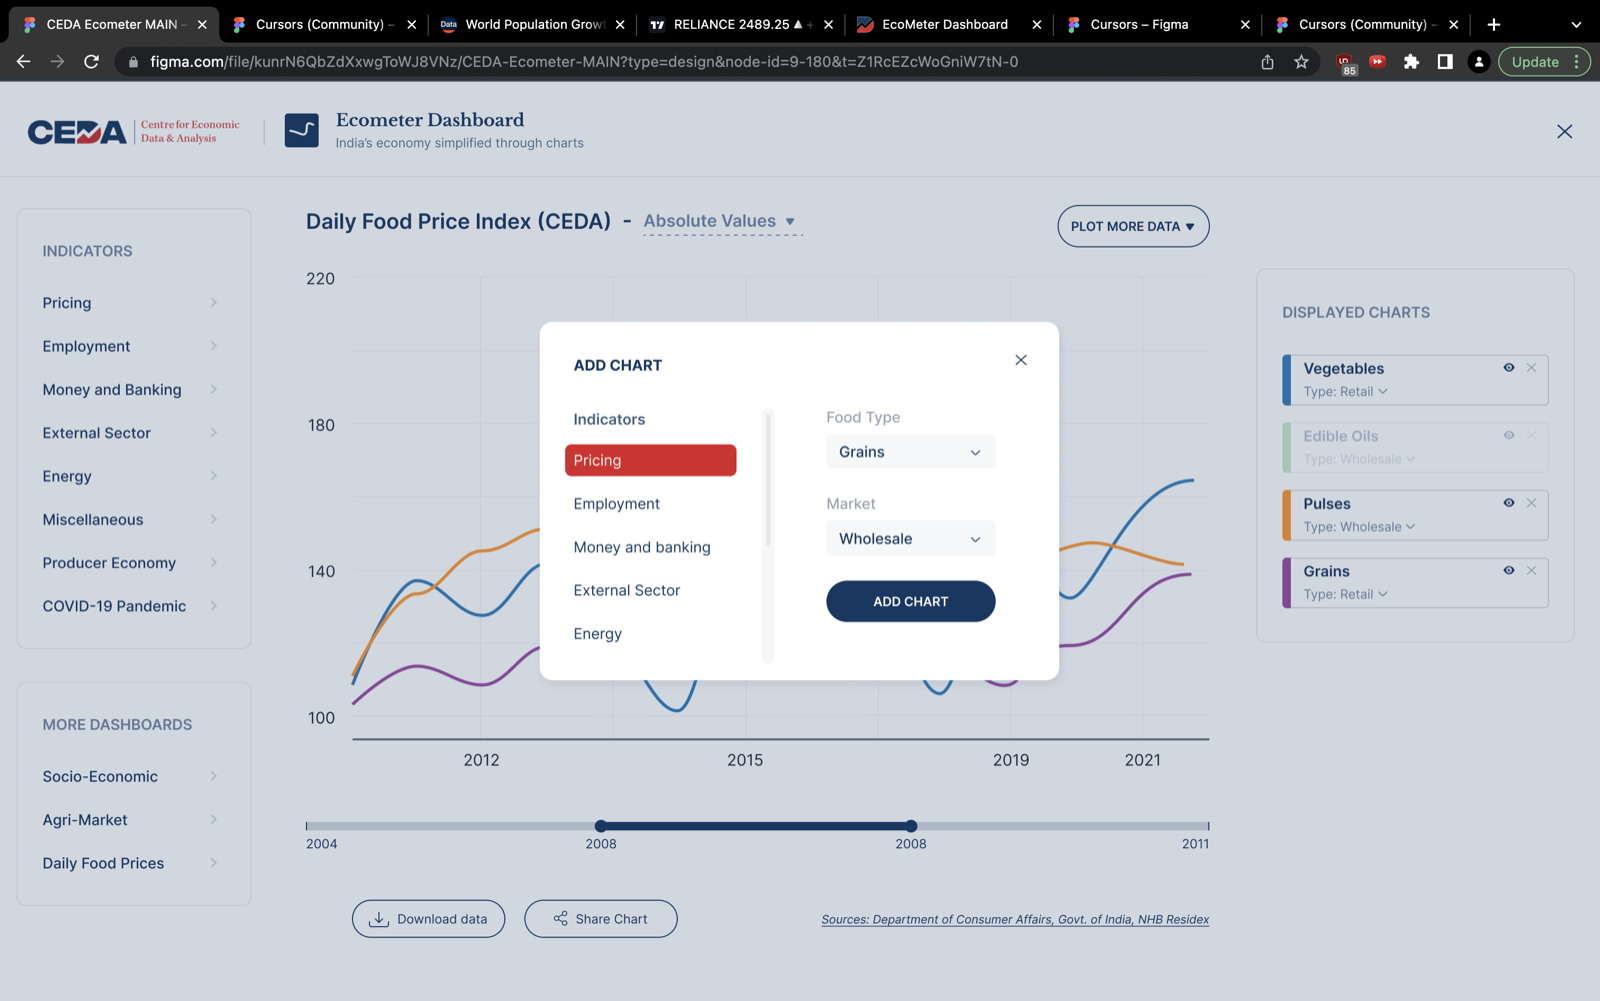
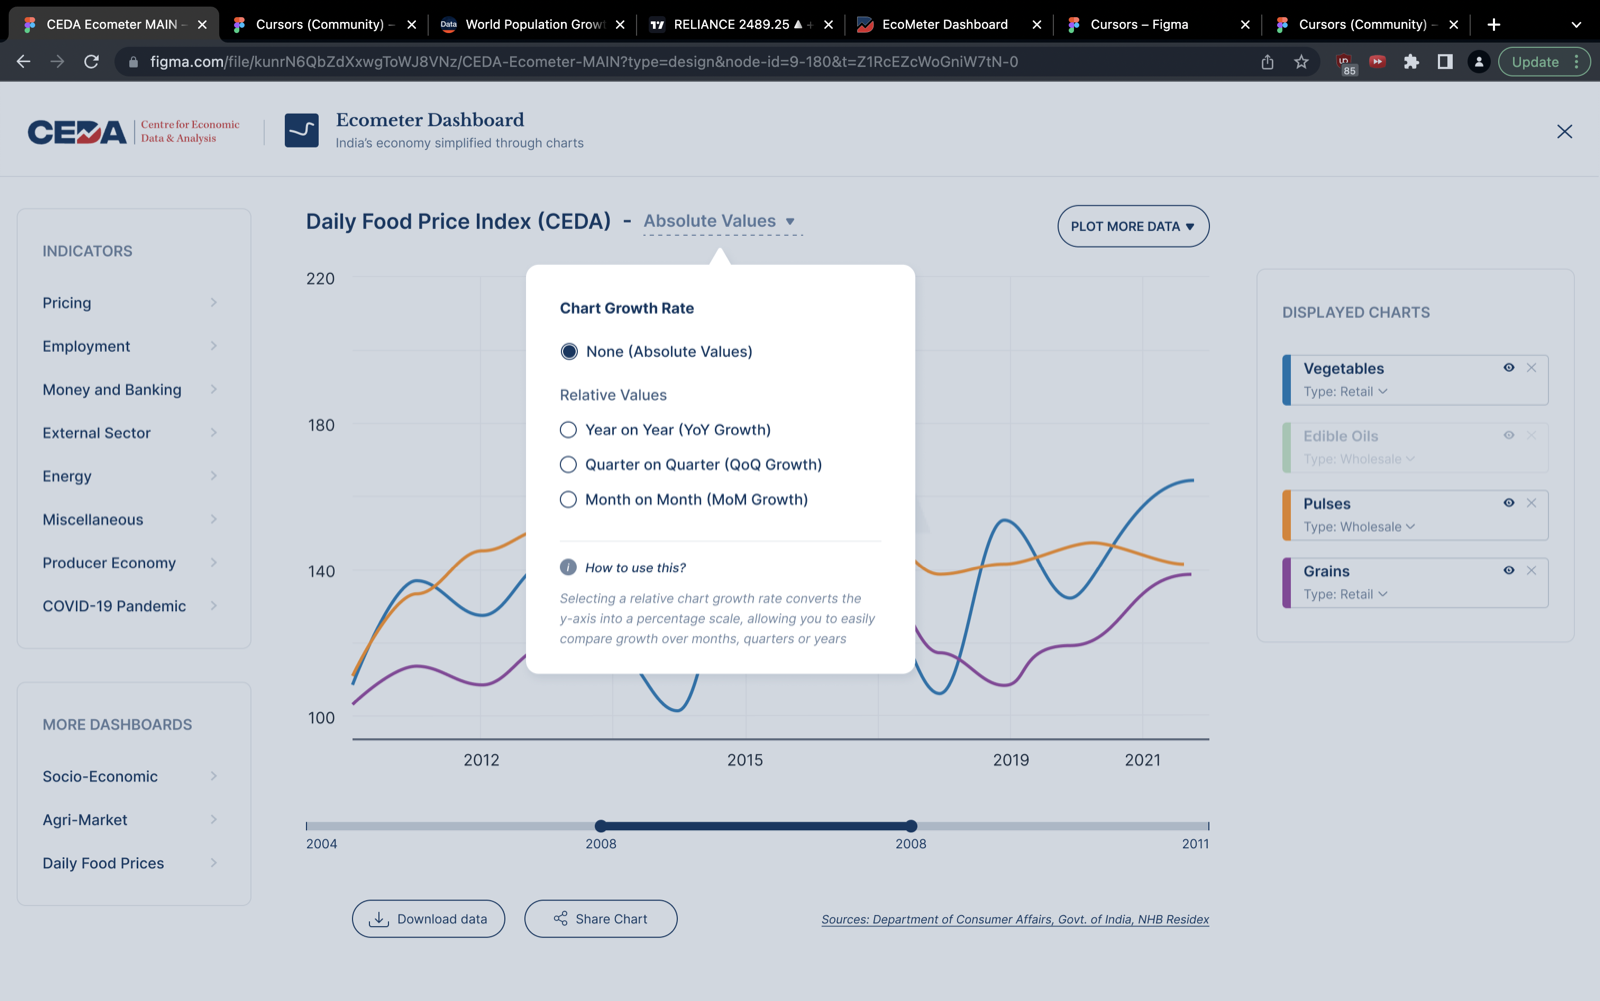
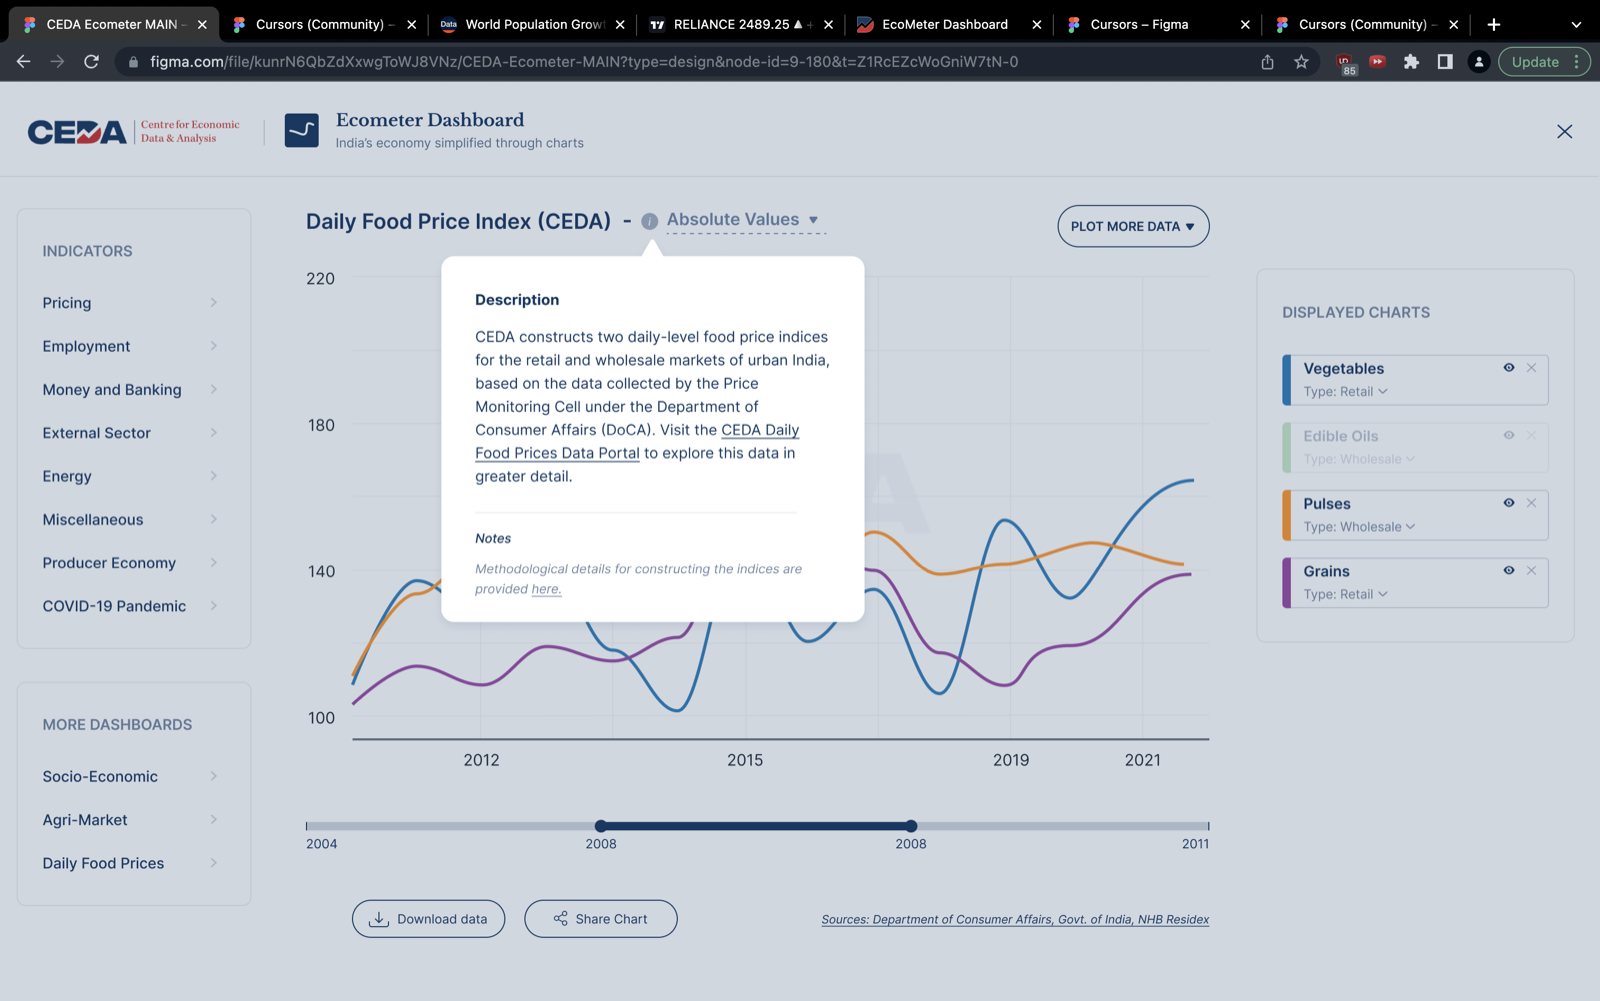
Ecometer
CEDA’s portal for high-frequency economic data.
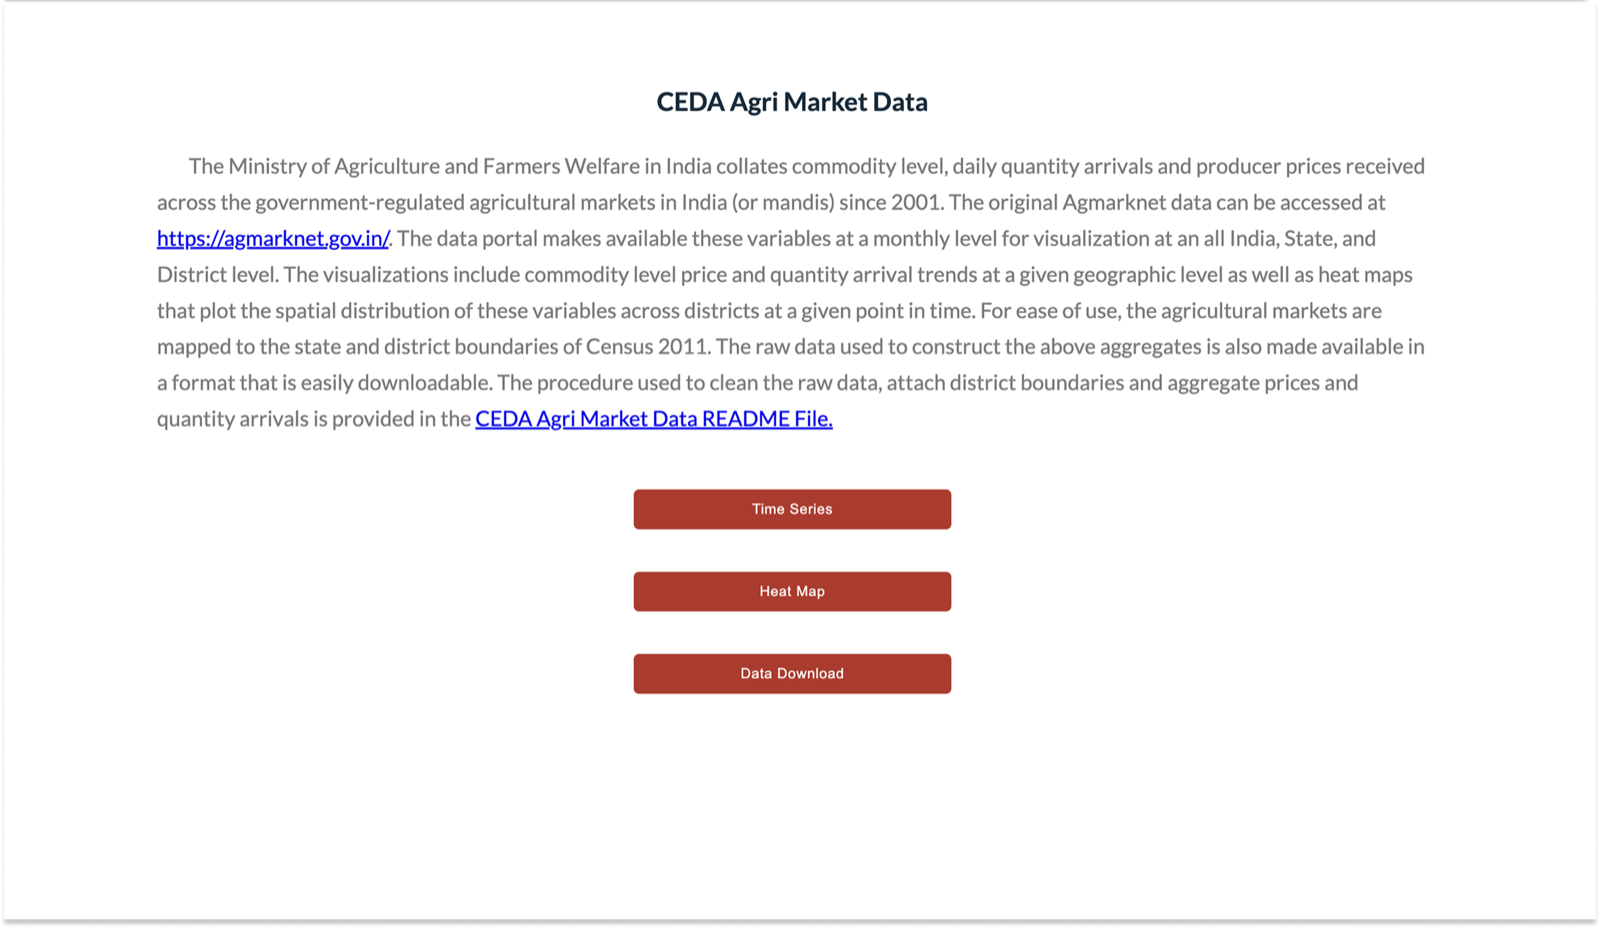
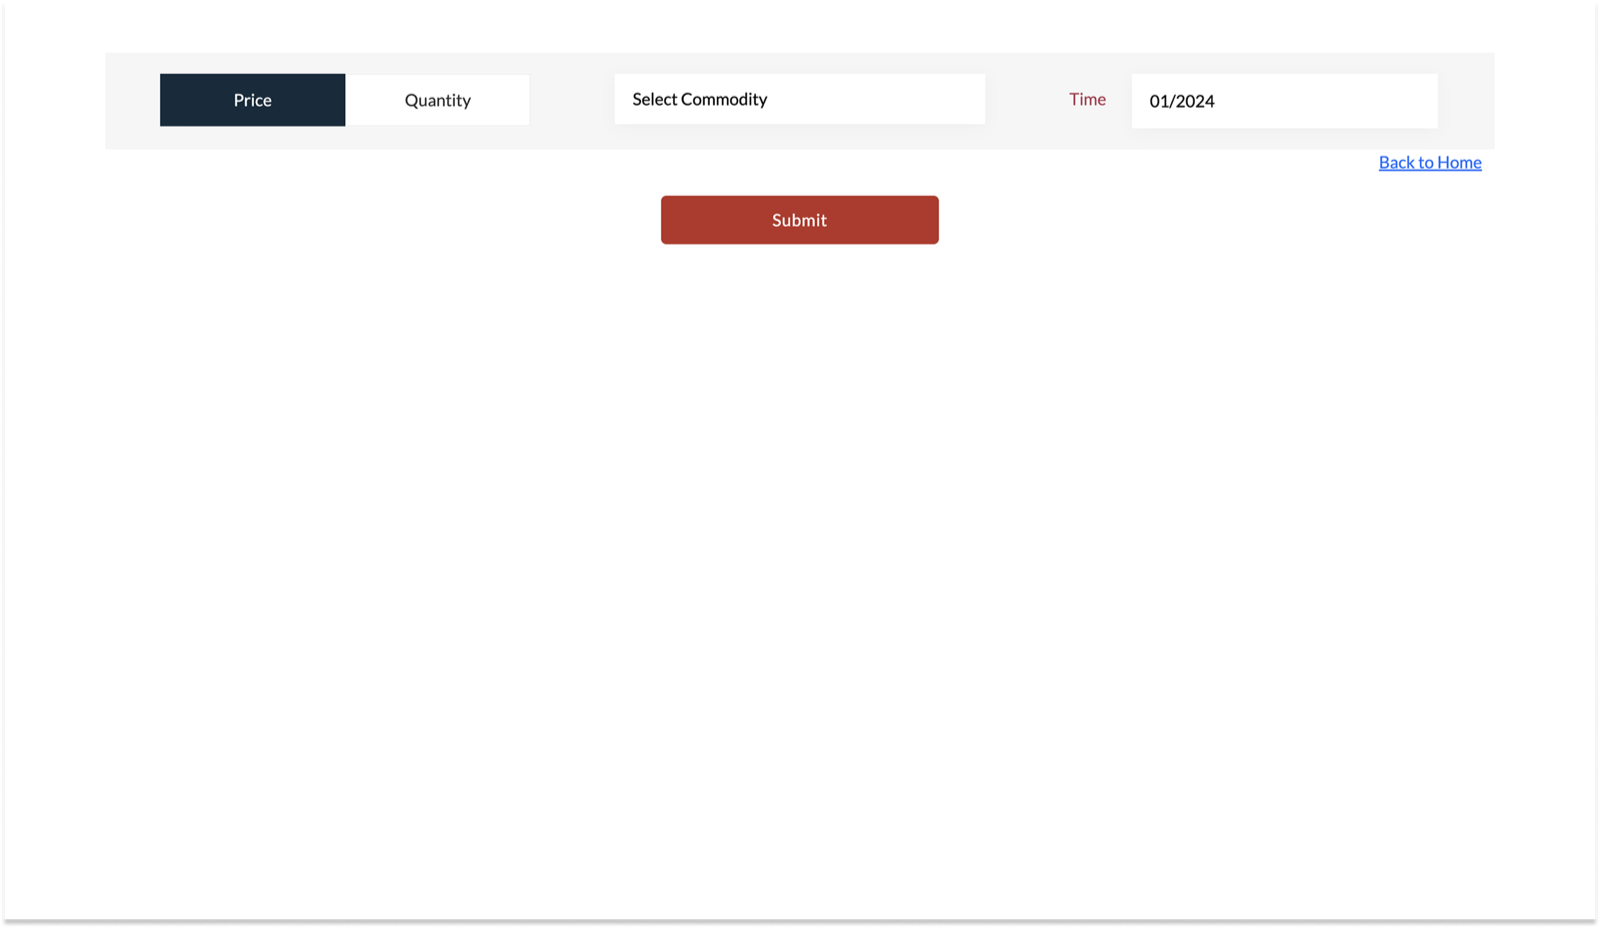
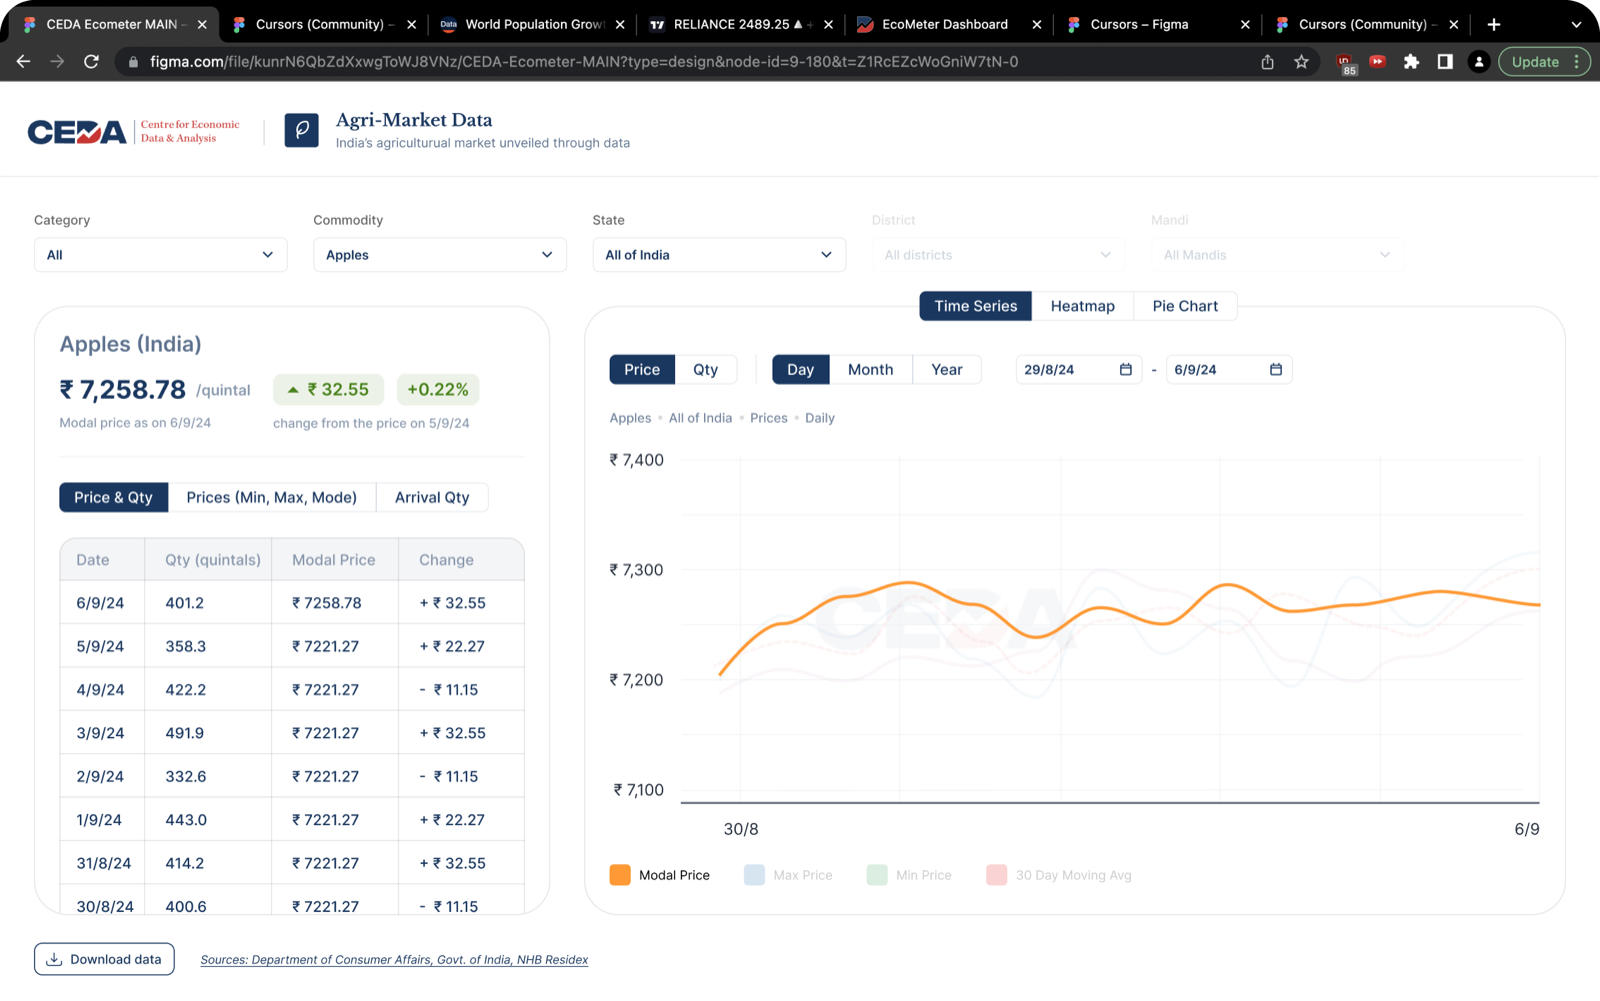
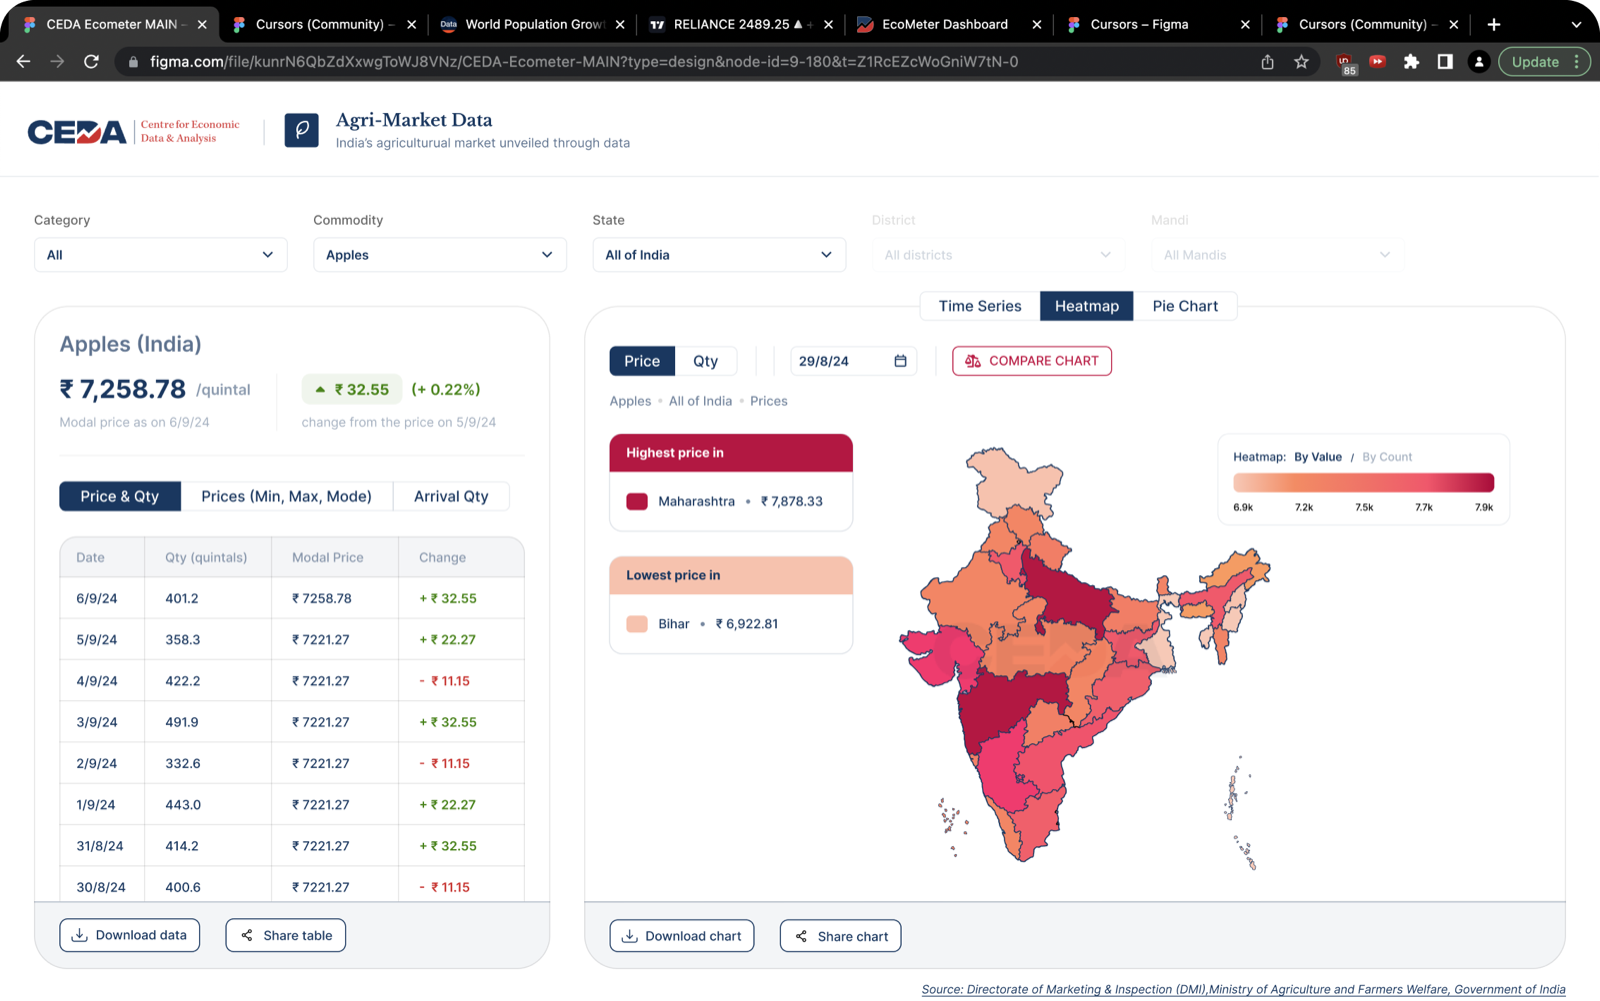
Agrimarket
CEDA’s portal for India’s high-frequency agricultural market data. This is how the Agrimarket portal looked previously:
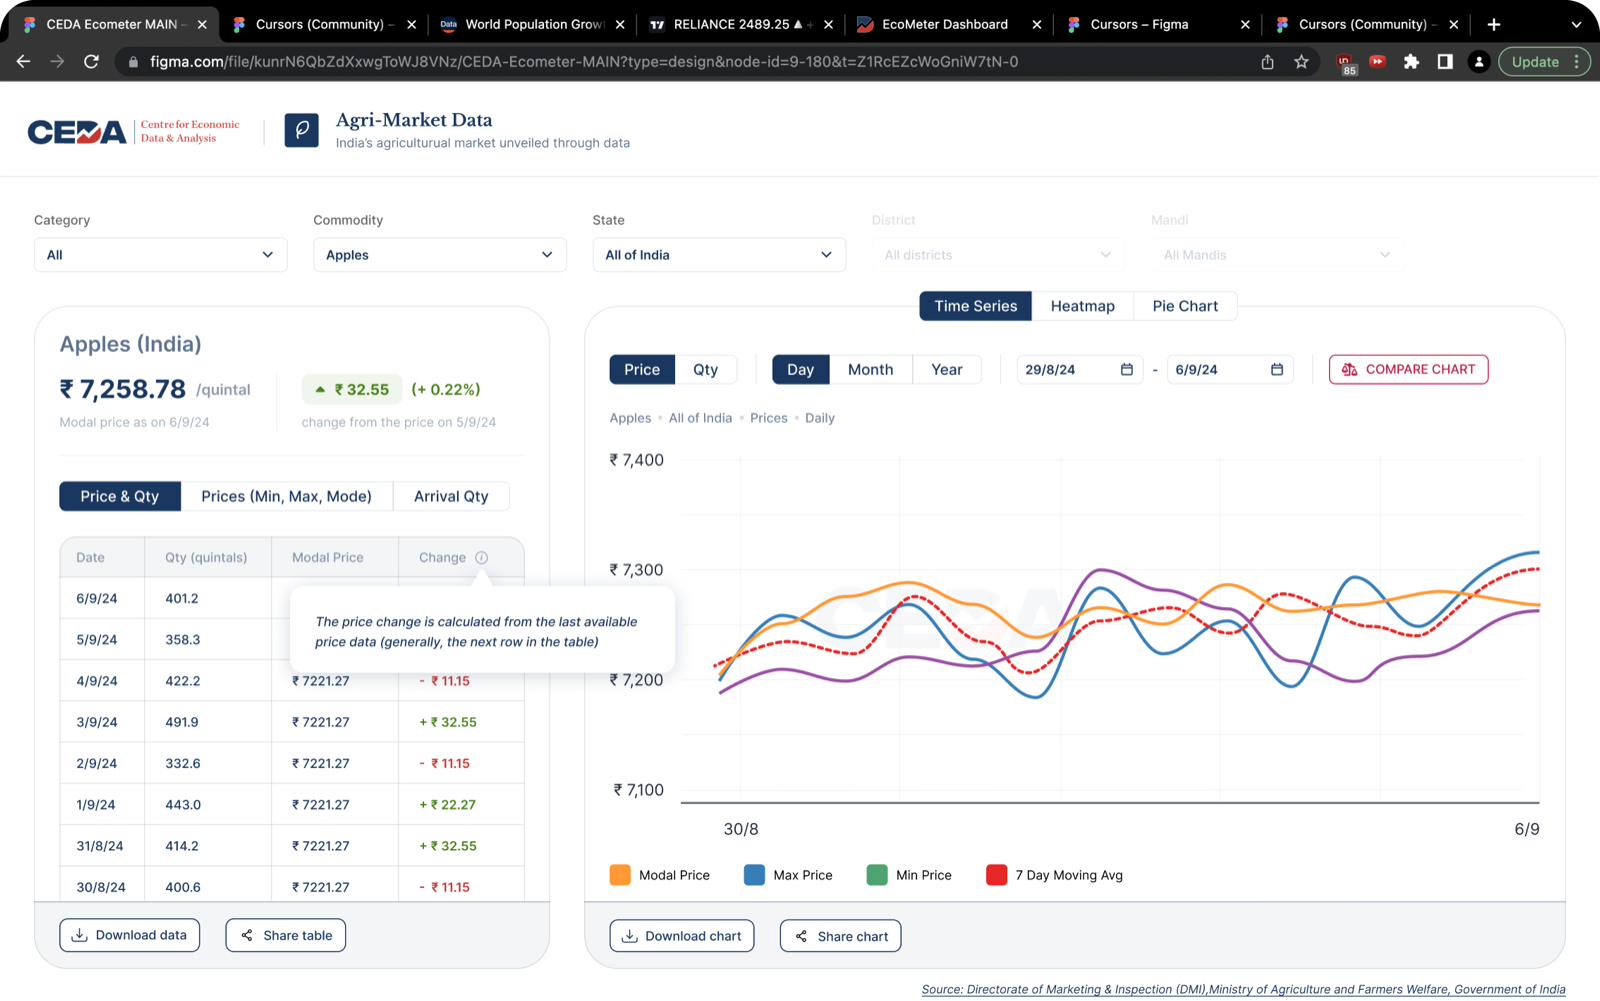
After the redesign:
We hired Priyank to redesign our dated suite of economic dashboards. And he did an excellent job. The redesigned dashboards are a treat to interact with. We will definitely work with him again.
This was part of an overall redesign of three CEDA dashboards. The flagship one is documented in the SEDP case study.
Fin.